Udacity机器人软件工程师课程笔记(二十二) - 物体识别 - 色彩直方图,支持向量机SVM
物体识别
1.HSV色彩空间
如果要进行颜色检测,HSV颜色空间是当前最常用的。
HSV(Hue, Saturation, Value)是根据颜色的直观特性由A. R. Smith在1978年创建的一种颜色空间, 也称六角锥体模型(Hexcone Model)。这个模型中颜色的参数分别是:色调(H),饱和度(S),亮度(V)。
HSV模型的三维表示从RGB立方体演化而来。设想从RGB沿立方体对角线的白色顶点向黑色顶点观察,就可以看到立方体的六边形外形。六边形边界表示色彩,水平轴表示纯度,明度沿垂直轴测量。
2.颜色直方图
使用生成的点云,将需要为3D空间中找到的点构造颜色直方图。但是,出于示例练习的目的,对2D图像中的像素进行操作就足够了。
首先我们先输出RGB图像的直方图,程序如下:
import matplotlib.image as mpimg
import matplotlib.pyplot as plt
import numpy as np# 载入图片
image = mpimg.imread('hsv_image.jpg')# 取R, G, B的直方图
r_hist = np.histogram(image[:, :, 0], bins=32, range=(0, 256))
g_hist = np.histogram(image[:, :, 1], bins=32, range=(0, 256))
b_hist = np.histogram(image[:, :, 2], bins=32, range=(0, 256))# 创建 bin 中心
print(r_hist)
bin_edges = r_hist[1]
bin_centers = (bin_edges[1:] + bin_edges[0:len(bin_edges)-1]) / 2# 绘制直方图
fig = plt.figure(figsize=(12, 3))
plt.subplot(131)
plt.bar(bin_centers, r_hist[0])
plt.xlim(0, 256)
plt.title('R Histogram')
plt.subplot(132)
plt.bar(bin_centers, g_hist[0])
plt.xlim(0, 256)
plt.title('G Histogram')
plt.subplot(133)
plt.bar(bin_centers, b_hist[0])
plt.xlim(0, 256)
plt.title('B Histogram')
plt.show()
直方图输出如下:

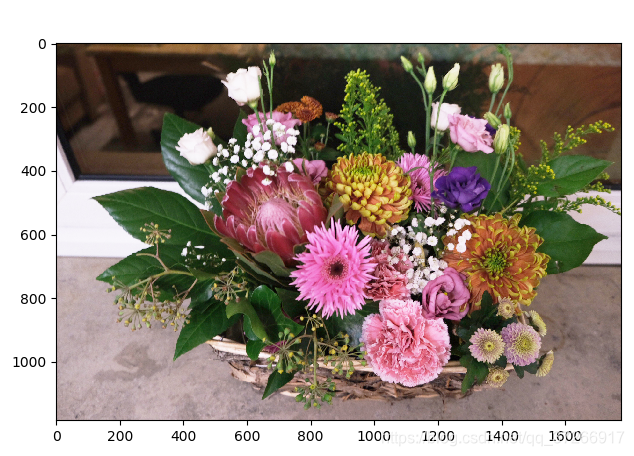
使用的图片为:

绘制HSV直方图,程序如下:
import matplotlib.image as mpimg
import matplotlib.pyplot as plt
import numpy as np
import cv2def color_hist(img, nbins=32, bins_range=(0, 256)):img_hsv = cv2.cvtColor(img, cv2.COLOR_RGB2HSV)h_hist = np.histogram(img_hsv[:, :, 0], bins=nbins, range=bins_range)s_hist = np.histogram(img_hsv[:, :, 1], bins=nbins, range=bins_range)v_hist = np.histogram(img_hsv[:, :, 2], bins=nbins, range=bins_range)# 转换为浮点数,保证在下一步不进行整数除法hist_features = np.concatenate((h_hist[0], s_hist[0], v_hist[0])).astype(np.float64)# 对结果归一化,使直方图中所有bin的总和为1norm_features = hist_features / np.sum(hist_features)return norm_features# 载入图片
image = mpimg.imread('hsv_image.jpg')
feature_vec = color_hist(image)
plt.imshow(image)if feature_vec is not None:fig = plt.figure(figsize=(12, 6))plt.plot(feature_vec)plt.title('HSV Feature Vector', fontsize=30)plt.tick_params(axis='both', which='major', labelsize=20)fig.tight_layout()plt.show()
else:print('Your function is returing None..')
输出如下:

3.支持向量机SVM
支持向量机或“ SVM”只是一种特殊的受监督机器学习算法的名称,它可以将数据集的参数空间表征为离散类。

SVM通过将迭代方法应用于训练数据集来工作,其中训练集中的每个项目都由特征向量和标签来表征。在上图中,每个点仅由两个特征(A和B)表征。每个点的颜色与其标签相对应,或者与其在数据集中表示的对象类别相对应。
将SVM应用于此训练集可将/整个参数空间表征为离散的类。参数空间中类之间的划分称为“决策边界”,在这里由覆盖在数据上的彩色多边形表示。创建决策边界意味着考虑具有功能但没有标签的新对象时,可以立即将其分配给特定的类。换句话说,一旦对SVM进行了训练,就可以将其用于对象识别。
Scikit-Learn中的SVM
sklearnPython中的Scikit-Learn或软件包提供了多种SVM实现。为了达到我们的目的,我们将使用带有线性内核的基本SVM,因为它往往在分类方面做得很好,并且比更复杂的实现运行得更快,但是有必要查看sklearn.svm软件包中的其他可能性。
训练数据
在训练SVM之前,我们需要一个标记数据集。为了快速生成一些数据,我们将使用cluster_gen()功能,我们在前面定义的教训聚类市场细分。但是,现在,我们将为每个群集数据点以及x和y位置提供函数输出标签
n_clusters = 5
clusters_x, clusters_y, labels = cluster_gen(n_clusters)
在这种情况下,特征是聚类点的x和y位置,标签只是与每个聚类关联的数字。要将它们用作训练数据,需要转换为sklearn.svm.SVC()期望的格式,它是形状(n_samples, m_features)和长度标签的功能集n_samples(在这种情况下,n_samples是聚类点的总数,m_features为2 )。在机器学习应用程序中,通常会调用功能集X和标签y。
根据cluster_gen()的输出格式,可以创建如下特性和标签:
import numpy as np
X = np.float32((np.concatenate(clusters_x), np.concatenate(clusters_y))).transpose()
y = np.float32((np.concatenate(labels)))
整理好训练数据后,sklearn就可以轻松创建和训练SVM!
from sklearn import svm
svc = svm.SVC(kernel='linear').fit(X, y)
在下面的程序中,可以更改数据集。可以在np.random.seed(424)语句中更改数字以生成其他数据集。可以查看sklearn.svm.SVC()的文档,以查看可以调整的参数以及结果如何变化。
import numpy as np
import matplotlib.pyplot as plt
from sklearn import svm# 定义一个函数来生成集群
def cluster_gen(n_clusters, pts_minmax=(100, 500), x_mult=(2, 7), y_mult=(2, 7),x_off=(0, 50), y_off=(0, 50)):# n_clusters = 要生成的集群数量# pts_minmax = 每个集群的点数范围# x_mult = 乘法器的范围,在x方向修改集群的大小# y_mult = 乘法器的范围,在y方向修改集群的大小# x_off = 簇在x方向上的位置偏移范围# y_off = 簇在y方向上的位置偏移范围# 初始化一些空列表以接收集群成员位置clusters_x = []clusters_y = []labels = []# 生成随机值给定参数范围n_points = np.random.randint(pts_minmax[0], pts_minmax[1], n_clusters)x_multipliers = np.random.randint(x_mult[0], x_mult[1], n_clusters)y_multipliers = np.random.randint(y_mult[0], y_mult[1], n_clusters)x_offsets = np.random.randint(x_off[0], x_off[1], n_clusters)y_offsets = np.random.randint(y_off[0], y_off[1], n_clusters)# 生成随机集群给定参数值for idx, npts in enumerate(n_points):xpts = np.random.randn(npts) * x_multipliers[idx] + x_offsets[idx]ypts = np.random.randn(npts) * y_multipliers[idx] + y_offsets[idx]clusters_x.append(xpts)clusters_y.append(ypts)labels.append(np.zeros_like(xpts) + idx)# 返回集群位置和标签return clusters_x, clusters_y, labelsnp.random.seed(424)  # 更改编号以生成不同的集群n_clusters = 3
clusters_x, clusters_y, labels = cluster_gen(n_clusters)# 转换为sklearn格式的培训数据集
X = np.float32((np.concatenate(clusters_x), np.concatenate(clusters_y))).transpose()
y = np.float32((np.concatenate(labels)))# 创建一个SVM实例,并对数据进行拟合。
ker = 'linear'
svc = svm.SVC(kernel=ker).fit(X, y)# 创建一个网格,我们将使用彩色来确定表面
# Plotting Routine courtesy of: http://scikit-learn.org/stable/auto_examples/svm/plot_iris.html#sphx-glr-auto-examples-svm-plot-iris-py
# 注意:这种配色方案在> 7个簇或更多的地方失效h = 0.2  # 在网格中的步长
x_min, x_max = X[:, 0].min() - 1, X[:, 0].max() + 1  # -1 and +1 to add some margins
y_min, y_max = X[:, 1].min() - 1, X[:, 1].max() + 1
xx, yy = np.meshgrid(np.arange(x_min, x_max, h),np.arange(y_min, y_max, h))# 对网格的每个块进行分类(用于分配其颜色)
Z = svc.predict(np.c_[xx.ravel(), yy.ravel()])# 将结果放入颜色图中
Z = Z.reshape(xx.shape)
plt.contourf(xx, yy, Z, cmap=plt.cm.coolwarm, alpha=0.8)# 绘制训练点
plt.scatter(X[:, 0], X[:, 1], c=y, cmap=plt.cm.coolwarm, edgecolors='black')
plt.xlim(xx.min(), xx.max())
plt.ylim(yy.min(), yy.max())
plt.xticks(())
plt.yticks(())
plt.title('SVC with '+ker+' kernel', fontsize=20)
plt.show()
输出如下:

4.SVM图像分类
我们在,我们已经了解了如何使用SVM对多类数据集进行分类,但是只有两个功能描述了每个元素。有了点云数据,w将拥有一个丰富的功能集,其中包含颜色和表面法线直方图。具有丰富功能集的分类与具有两个功能的分类工作相同,但更难以可视化,因此我们
更多相关:
-
有一天,我写了一个自信满满的自定义组件myComponent,在多个页面import使用了,结果控制台给我来这个 我特么裤子都脱了,你给我来这个提示是几个意思 仔细一看 The Component 'MyComponentComponent' is declared by more than one NgModule...
-
创建一个带路由的项目,依次执行下面每行代码 ng n RouingApp --routingcd RouingAppng g c components/firstng g c components/secondng g m components/second --routing 代码拷贝: import {NgModul...
-
cnpm install vue-quill-editor cnpm install quill-image-drop-module cnpm install quill-image-resize-module 执行上面的命令安装,然后在main.js下面加入 //引入quill-editor编辑器import...
-
首先要理解Vue项目加载顺序: index.html → main.js → App.vue → nav.json→ routes.js → page1.vue index.html建议加入样式
-
简单记录平时画图用到的python 便捷小脚本 1. 从单个文件输入 绘制坐标系图 #!/usr/bin/python # coding: utf-8 import matplotlib.pyplot as plt import numpy as np import matplotlib as mpl import sysf...
-
1.Fashion-MNIST数据集 Fashion-MNIST数据集包括一个包含60,000个示例的训练集和一个包含10,000个示例的测试集。每个示例是一个28x28灰度图像,与来自以下10个类的标签相关联: T恤/上衣裤子套衫连衣裙外套凉鞋衬衫运动鞋包短靴 Source: https://github.com/zaland...